How monitoring can kill your Spring Boot 1.x application performance
Any system or application on production without good monitoring should be banned. Monitoring, especially in a large distributed system, is not an option, it’s a must. I hope that this is pretty obvious and I don’t have to explain why. At our company blog, we have been touching this topic many times.
Right now our typical stack for monitoring is Prometheus + Grafana. Prometheus for storing time series data, and Grafana for visualizing them. The last thing missing is that your application should somehow expose metrics for Prometheus scraping mechanism. Usually, this is done by creating some monitoring endpoint with all registered metrics. An obvious approach for business metrics from your application. The problem starts when you want to monitor more low level/technical parameters like JVM metrics (CPU usage, heap usage, GC, etc), Kafka client metrics, Cassandra client metrics, etc. These metrics are already exposed from your code and you can access them via MBeans browser (jvisualvm plugin, or good old jconsole).
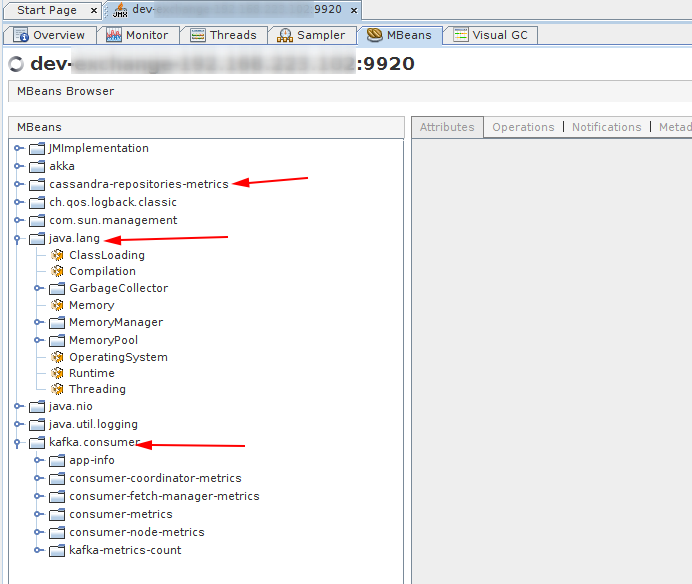
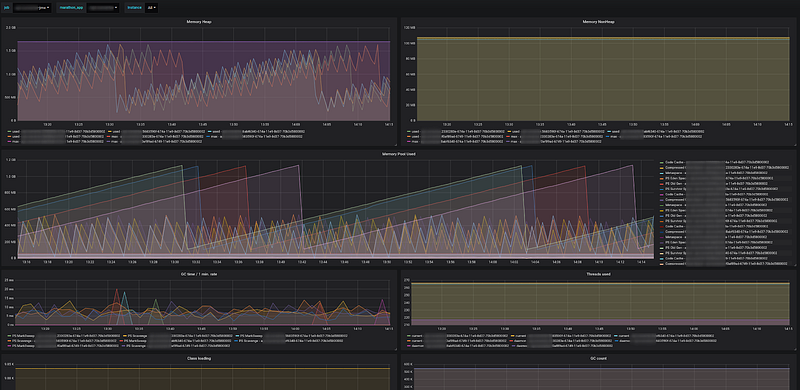
Fortunately, there is a tool — JMX exporter, which will automatically create an endpoint with all (or filtered) MBeans data. It’s a very convenient and standardized way of exposing common metrics, especially in the case of complex systems with many microservices. All these data can be represented by useful dashboards in Grafana for JVM monitoring:
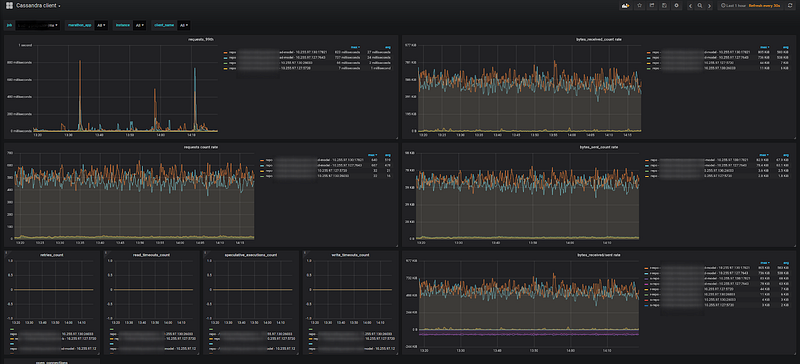
Cassandra client:
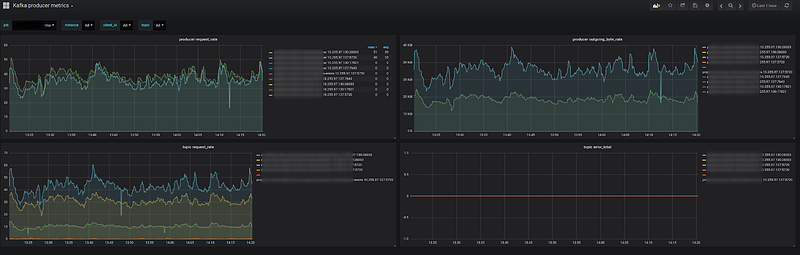
Kafka producer:
And many other interesting statistics about your application’s behavior.
The problem
What is the problem then? JMX exporter is a very simple piece of software, it just scans all the MBeans and exposes them as Prometheus metrics. The issue with this approach occurs when you’ll use it with a Spring Boot 1.x application (yes, I know that this version will be EOL very soon, but some sad people are still using it). To be precise, when you’ll use Spring Boot Actuator features without caution. The Actuator is a really awesome idea. It provides a lot of useful endpoints for monitoring and debugging your application. If you’re from the Spring ecosystem there is no way that you’re not using it already, usually with default settings…
Imagine a situation, where the performance of one of your applications is very unstable. An HTTP endpoint’s 99th percentile response time should be close to 50ms, but you are observing a lot of spikes to even 300ms. CPU, memory, GC are fine. The load is really low max 10 req/s. All the typical problems with the performance have been checked and everything looks good. Finally, after some profiling, you can spot something interesting.
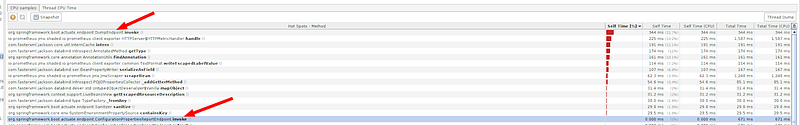
As it turns out, Spring Boot exposes all Actuator endpoints as MBeans by default, so every 10 seconds Prometheus hits the application endpoint with metrics. Every pull scans all MBeans, and each time one specific MBean is invoked:
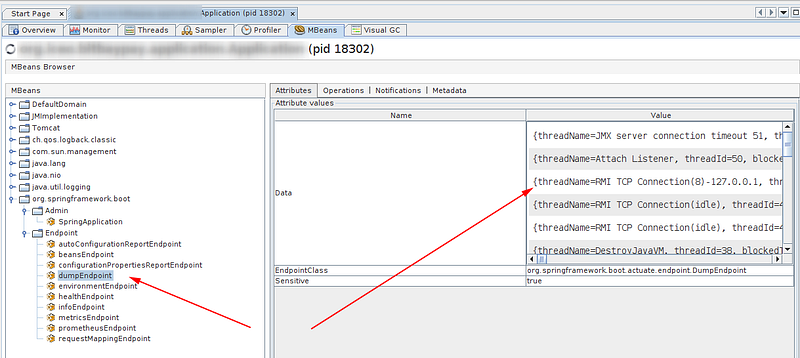
Long story short, every 10 seconds, our monitoring infrastructure was invoking a thread dump on our application, which was the root cause of the performance problems. Thread dump generation is a stop-the-world operation in JVM. Very useful for debugging, but clearly shouldn’t be overused.
The solution
After distilling the problem, finding the solution was very easy. Either you can configure the JMX exporter to ignore some MBeans, or you can turn off problematic Actuator endpoint, or you can turn off completely Actuator endpoints as MBeans:
spring.jmx.enabled=false
In some cases, using the JMX exporter might be an overkill. As always — it depends on what you want to achieve. If you just need JVM metrics, you can do this with Prometheus hotspot client only.
Take away
- This issue was already fixed in Spring Boot 2.x, if you are using Spring Boot 1.x check if your Actuator configuration is production ready.
- Learn how to use a JVM profiler, it could be jvisualvm (which is not actually a profiler, but in this case, it was good enough) or Java Mission Control.
- Monitoring is always costly (setup, additional infrastructure, etc) and it will influence your system performance at some level. Usually, this level is irrelevant, but as you’ve just read sometimes it’s worth to check it :)
- Never resign from monitoring, because it will be like driving a car without a speedometer. Sooner or later, you will pay a high price for that.
Related blog:
Spring boot interview questions